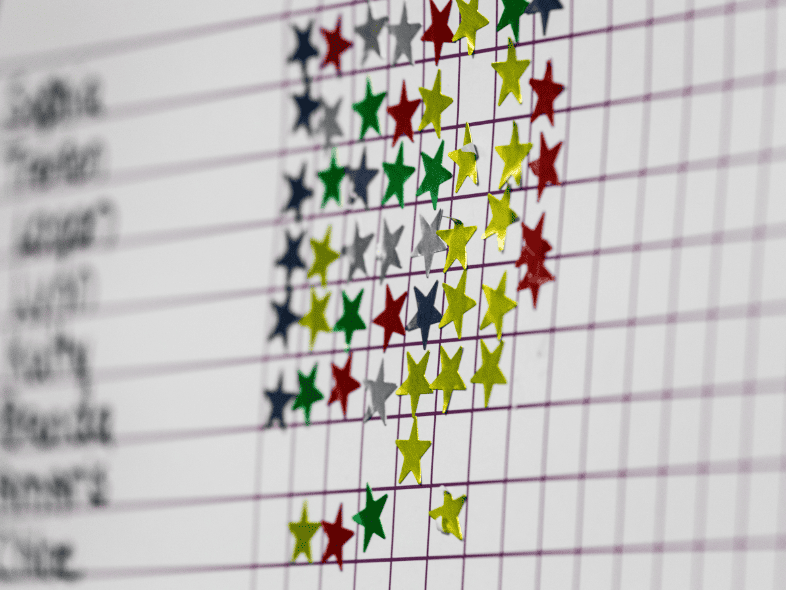
In the dynamic landscape of modern education, managing student behavior is an essential component of creating a conducive learning environment. One popular tool that has gained traction in recent years is the use of behavior charts in the classroom.
These visual aids serve as powerful instruments for encouraging positive behavior and fostering a sense of responsibility among students. In this blog post, we will delve into the world of behavior chart for classroom, exploring their benefits, different types, and strategies for effective implementation.

Understanding Behavior Charts
Behavior charts are visual tools designed to track and encourage desired behaviors while discouraging undesirable ones. These charts typically display a list of targeted behaviors, often referred to as goals or expectations, along with corresponding rewards or consequences.
By clearly outlining expectations and their associated outcomes, behavior charts help students understand what is expected of them and provide a tangible framework for them to strive towards.
Benefits of Behavior Charts
Clarity and Transparency
One of the primary advantages of charts is the clarity they offer. By listing specific behaviors that are expected of students, teachers create a transparent environment where everyone knows what is required. This clarity reduces confusion and potential misunderstandings, allowing students to make informed choices about their behavior.
Positive Reinforcement
Behavior charts rely heavily on positive reinforcement, a psychological concept that rewards desired behaviors. When students consistently meet the expectations outlined on the chart, they earn rewards, which can range from stickers to privileges or special treats. This positive reinforcement not only encourages students to maintain good behavior but also reinforces a sense of accomplishment and self-worth.
Goal Setting and Achievement
Behavior charts provide a tangible way for students to set and achieve goals. As they strive to earn rewards by meeting the specified expectations, they learn the value of goal setting and the satisfaction that comes from achieving those goals. This experience can translate into improved self-discipline and motivation to excel in various areas of their education.
Ownership and Accountability
When students are involved in the creation or selection of behaviors on the chart, they feel a sense of ownership over their actions. This sense of ownership, coupled with the visual representation of their progress, fosters a greater sense of accountability for their behavior. Students become active participants in their own growth and development.
Consistency and Routine
Behavior charts contribute to the establishment of consistent routines in the classroom. When expectations are clearly defined and consistently reinforced, students develop a sense of predictability and stability. This, in turn, can reduce anxiety and create a safe and conducive learning environment.
Types of Behavior Charts
There are various types of charts, each with its own unique approach to promoting positive behavior. Here are a few popular ones:
Individual Behavior Charts
Individual behavior charts are tailored to each student’s specific needs and goals. Teachers work with students to identify areas for improvement or specific behaviors they want to encourage. The chart lists these behaviors and the corresponding rewards. This personalized approach allows for targeted intervention and recognition of individual progress.
Classwide Behavior Charts
Classwide charts focus on the collective behavior of the entire class. The chart lists behaviors that the entire class should aim to exhibit. When the class meets the expectations, they earn rewards. This approach fosters a sense of teamwork and encourages students to support one another in maintaining positive behavior.
Token Economy Charts
Token economy charts introduce an additional layer of engagement by using tokens as a form of currency. Students earn tokens for displaying positive behaviors, and these tokens can later be exchanged for rewards. This approach simulates real-world systems and teaches students about:
- saving,
- budgeting,
- and delayed gratification.
Strategies for Effective Implementation
Implementing charts successfully requires careful planning and execution. Here are some strategies to ensure their effectiveness:
1. Set Clear and Achievable Goals
The goals listed on the behavior chart should be specific, measurable, achievable, relevant, and time-bound (SMART). Clear goals give students a concrete target to work towards and increase their chances of success.
2. Use Appropriate Rewards
Select rewards that are meaningful to students and aligned with their interests. While tangible rewards like stickers or small prizes work well, non-material rewards like extra free time or the chance to choose a class activity can also be effective.
3. Consistency is Key
Consistency is crucial when using charts. Teachers should consistently monitor behavior, provide feedback, and distribute rewards according to the established criteria. Inconsistencies can lead to confusion and diminish the chart’s effectiveness.
4. Celebrate Progress
Celebrate both small and significant improvements. Recognizing incremental progress keeps students motivated and reinforces the idea that effort and positive behavior are valued.
5. Regularly Review and Adjust
Behavior charts should not be static. Regularly review and update the chart to reflect changing goals or evolving classroom dynamics. Additionally, involve students in the review process to gather their input and ensure their continued engagement.
6. Emphasize Growth, Not Perfection
Highlight the importance of progress and effort rather than perfection. Encourage students to learn from their mistakes and setbacks, fostering a growth mindset that values learning and development.
In Conclusion
Behavior charts are valuable tools that contribute to a positive classroom environment by promoting desired behaviors and teaching important life skills. With their ability to foster clarity, positivity, goal-setting, and accountability, charts empower students to become active participants in their own learning journey. By selecting the appropriate type of chart and implementing it effectively, educators can harness the power of charts to create a classroom where students thrive and succeed.


